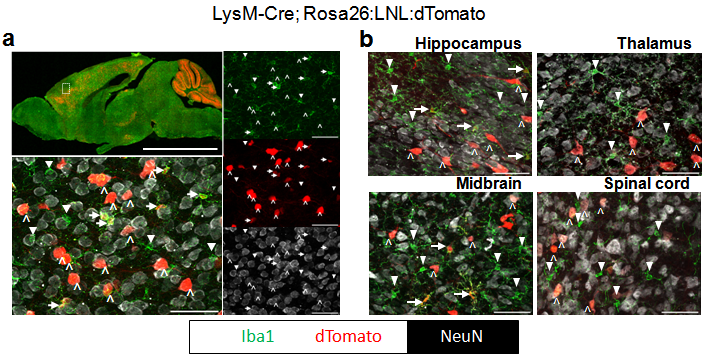
a, Histological characterization of tdTomato expression in brain from LysM-Cre; Rosa26:LSL:tdTomato. tdTomato expression is seen in red, Iba1 (microglia) in green, and neurons (NeuN) in white. Upper left shows low-power image of a mid-sagittal section. Lower left shows higher power image of cortex. Images on right are individual color channels contributing to merged image in lower left. Right facing arrows indicate microglia expressing tdTomato (Iba1+; tdTomato+). Down facing triangles mark microglia not expressing tdTomato (Iba+; tdTomato-). Up facing carrots show large tdTomato+; NeuN+ cells. Scale bar in low power image is equal to 5mm, in high power images is equal to 50 µm. b, High power images of various brain regions (labeled above) from LysM-Cre; Rosa26:LSL:tdTomato. Colors, arrows, triangle carrots, and scale bars same as in a. Rosa26:LSL:tdTomato (http://jaxmice.jax.org/strain/007905.html), LysM-Cre (http://jaxmice.jax.org/strain/004781.html).
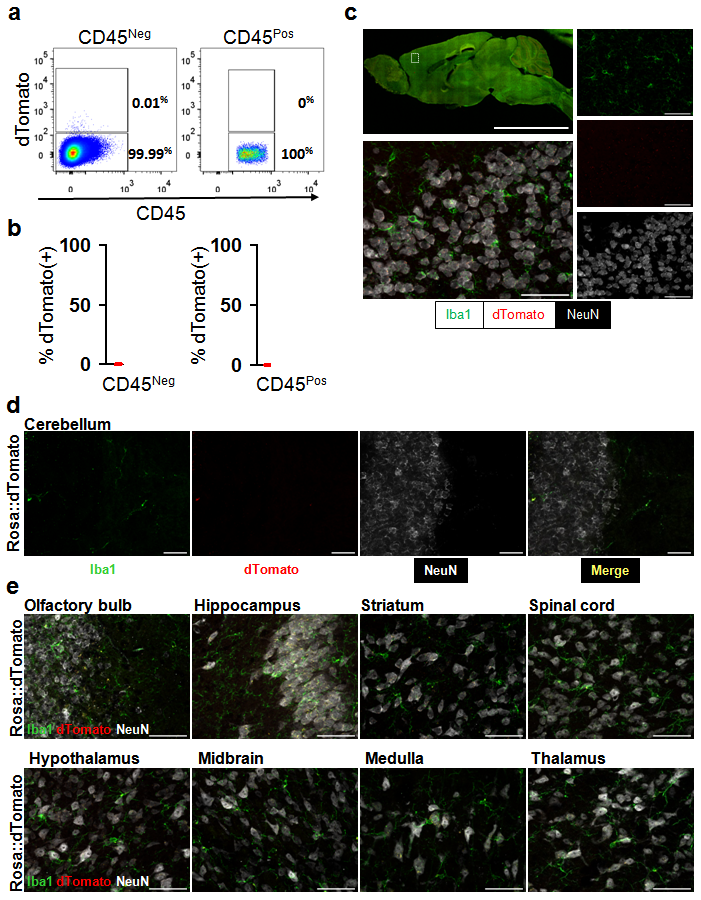
Different methods were used to determine whether Cre independent expression of dTomato exists in the reporter line. a, b Evaluation of dTomato+ microglia and non-microglia cells in control animals. a, Representative pseudocolor density plots of brain cells from Rosa26:LSL:tdTomato animals. Left flow panel shows the CD45-FITC negative cells, and right panel shows the CD45-FITC positive microglia. b, quantification (n=3) of the ratio of CD45-FITC negative and positive cells that express fluorescent reporter (dTomato). In CD45-FITC negative cells, the average ratio is 0.01%. In CD45-FITC positive cells, the average ratio is 0%. c, Histological characterization of dTomato expression in brain from Vav-CreNeg; Rosa26:LSL:tdTomato negative control animals. dTomato expression is seen in red, Iba1 (microglia) in green, and neurons (NeuN) in white. Upper left shows low-power image of a mid-sagittal section. Lower left shows higher power image of cortex. Images on right are individual color channels contributing to merged image in lower left. Scale bar in low power image is equal to 5mm, in high power images is equal to 50 µm. d, High power images of cerebellum from Vav-CreNeg; Rosa26:LSL:tdTomato negative control animals. First column shows microglia staining (Iba1, green), second column shows dTomato expression (red), third column shows NeuN staining (white), and fourth column shows the merged image. Scale bar is equal to 50 µm. e, Representative high power images of eight additional brain regions from Vav-CreNeg; Rosa26:LSL:tdTomato negative control animals. Colors and scale bars same as in d. Rosa26:LSL:tdTomato (http://jaxmice.jax.org/strain/007905.html).
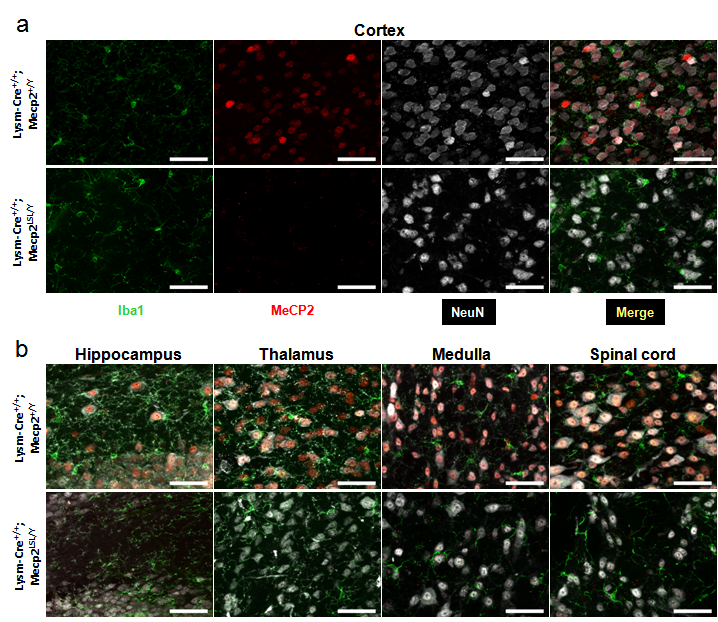
a, High power images of cortex from brains of two genotypes. Top row shows single channel images and merged image from LysM-Cre+/+; Mecp2+/Y animals (no cre, wild-type Mecp2). The first panel shows microglia (Iba1 expression) in green, the second panel shows MeCP2 protein in red, the third panel shows NeuN in white, and the fourth panel shows the merged image. Scale bar in all is 50 µm. The second row shows images from a brain from a LysM-Cre+/+; Mecp2LSL/Y animal (no Cre, inducible Mecp2 allele). with the same color and scale bar as previous. b, High power merged images from additional brain regions of the above two genotypes. Color and scale bars as in panel a. Mecp2LSL is formally known as Mecp2TM2Bird (http://jaxmice.jax.org/strain/006849.html).